MeritoInsight
An analytics platform that shows an app company which ads actually make money, and predicts what each new user will be worth weeks before the revenue arrives.
- Client
- Essence Technolab
- Services
- Web application, Data engineering, Dashboard design
- See which campaigns and ads earn back their cost
- Forecast each new user's 30-day value from their first days
- Compare every app on users, revenue and loyalty
- Break results down by campaign, ad, country and app
- Data comes straight from the apps, with no paid tracking tool
- One login for the whole team, with admin, analyst and viewer access
In short
MeritoInsight answers the question every app business asks about its ad budget: is this campaign bringing in users who will earn back what they cost? And it answers it in days instead of the month it normally takes to find out.
The problem
The company runs a portfolio of Android apps, pays for users through Google Ads and earns money back from in-app ads and purchases. But a new user's real value only becomes clear about 30 days after install. By then the ad budget has already been spent, so good campaigns grow too slowly and bad ones run too long.
What I built
A web dashboard that pulls together three things that normally live in different places: what was spent on ads, what each user does inside the app, and the money they bring in. On top of that sits a forecast of each new user's 30-day value.
How it works
- Each app reports what users do (installs, sessions, ads seen, purchases) through a small, secure piece of code added to the app.
- Every install is matched to the campaign and ad that brought the user in, using Google Play's own install data, so no paid tracking service is needed.
- Ad spend comes in from Google Ads, so cost and revenue sit side by side for every campaign, ad, country and app.
- The forecast looks at how a user behaves in their first few days and compares them with earlier users who behaved the same way. That gives an early estimate of what they will be worth by day 30.
- Put that estimate next to the cost of acquiring the user, and the answer is clear: scale the campaigns that pay back, pause the ones that don't.
The result
The team sees revenue, loyalty and return on ad spend for every app in one place, and can move ad budget based on a forecast within days, instead of waiting a month for the numbers.
Behind the scenes
Built with React for the dashboard and NestJS for the server. PostgreSQL stores the apps, campaigns and team accounts, and ClickHouse, a database built for fast analytics on large volumes of events, powers every chart. Redis handles incoming data and caching so dashboards load quickly.
Inside the app
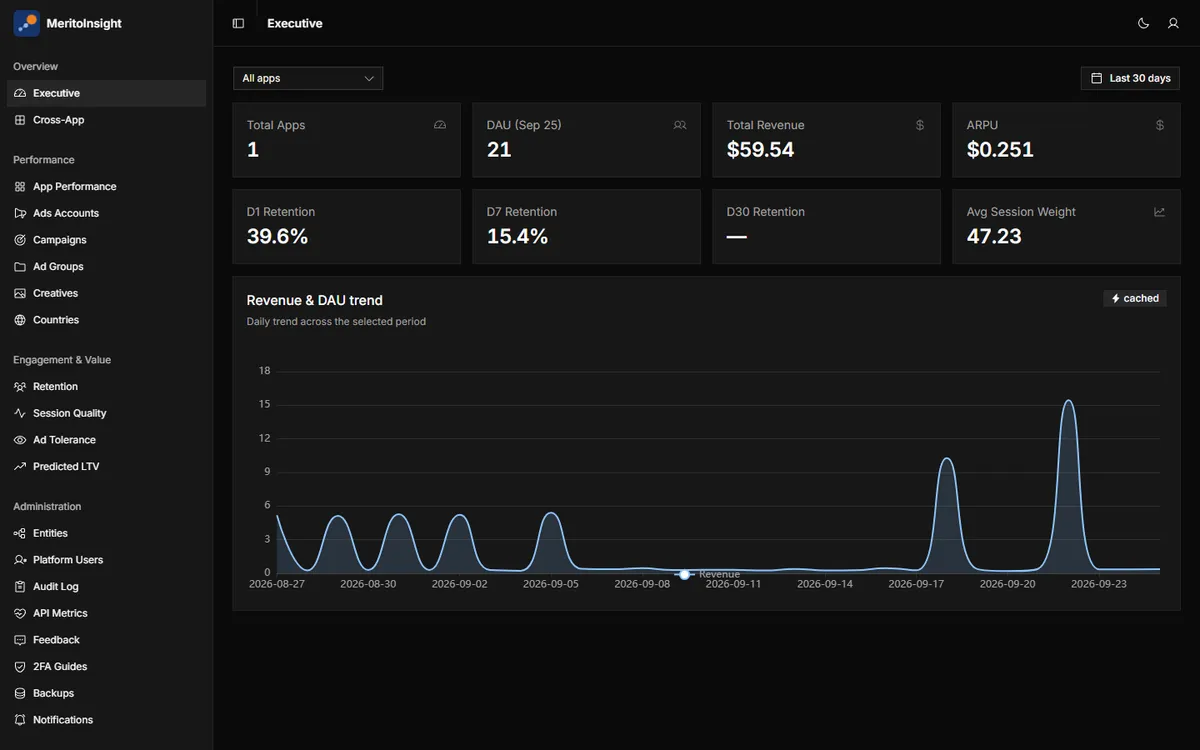
01Predicted value: what new users are expected to earn by day 30, grouped by how they behaved in their first few days. 02Campaigns: for each Google Ads campaign, installs, spend, cost per install and how much revenue came back for every dollar spent. 03App performance: daily users, revenue and how many users come back, for every app side by side. 04Retention: how many users return after 1, 3, 7 and 30 days, week by week. 05Creatives: which ad images and videos bring in users who stay and spend. 06Countries: users, revenue and loyalty by country. 07Engagement: a single score for how actively each user uses the app, and who the most valuable users are. 08Ad tolerance: how many ads users see, which ad formats earn the most, and how much comes from the most engaged users.